Algorithmic Trader: Generating 7.4% Alpha in Volatile Markets with a Quant Agent
1. Project Overview
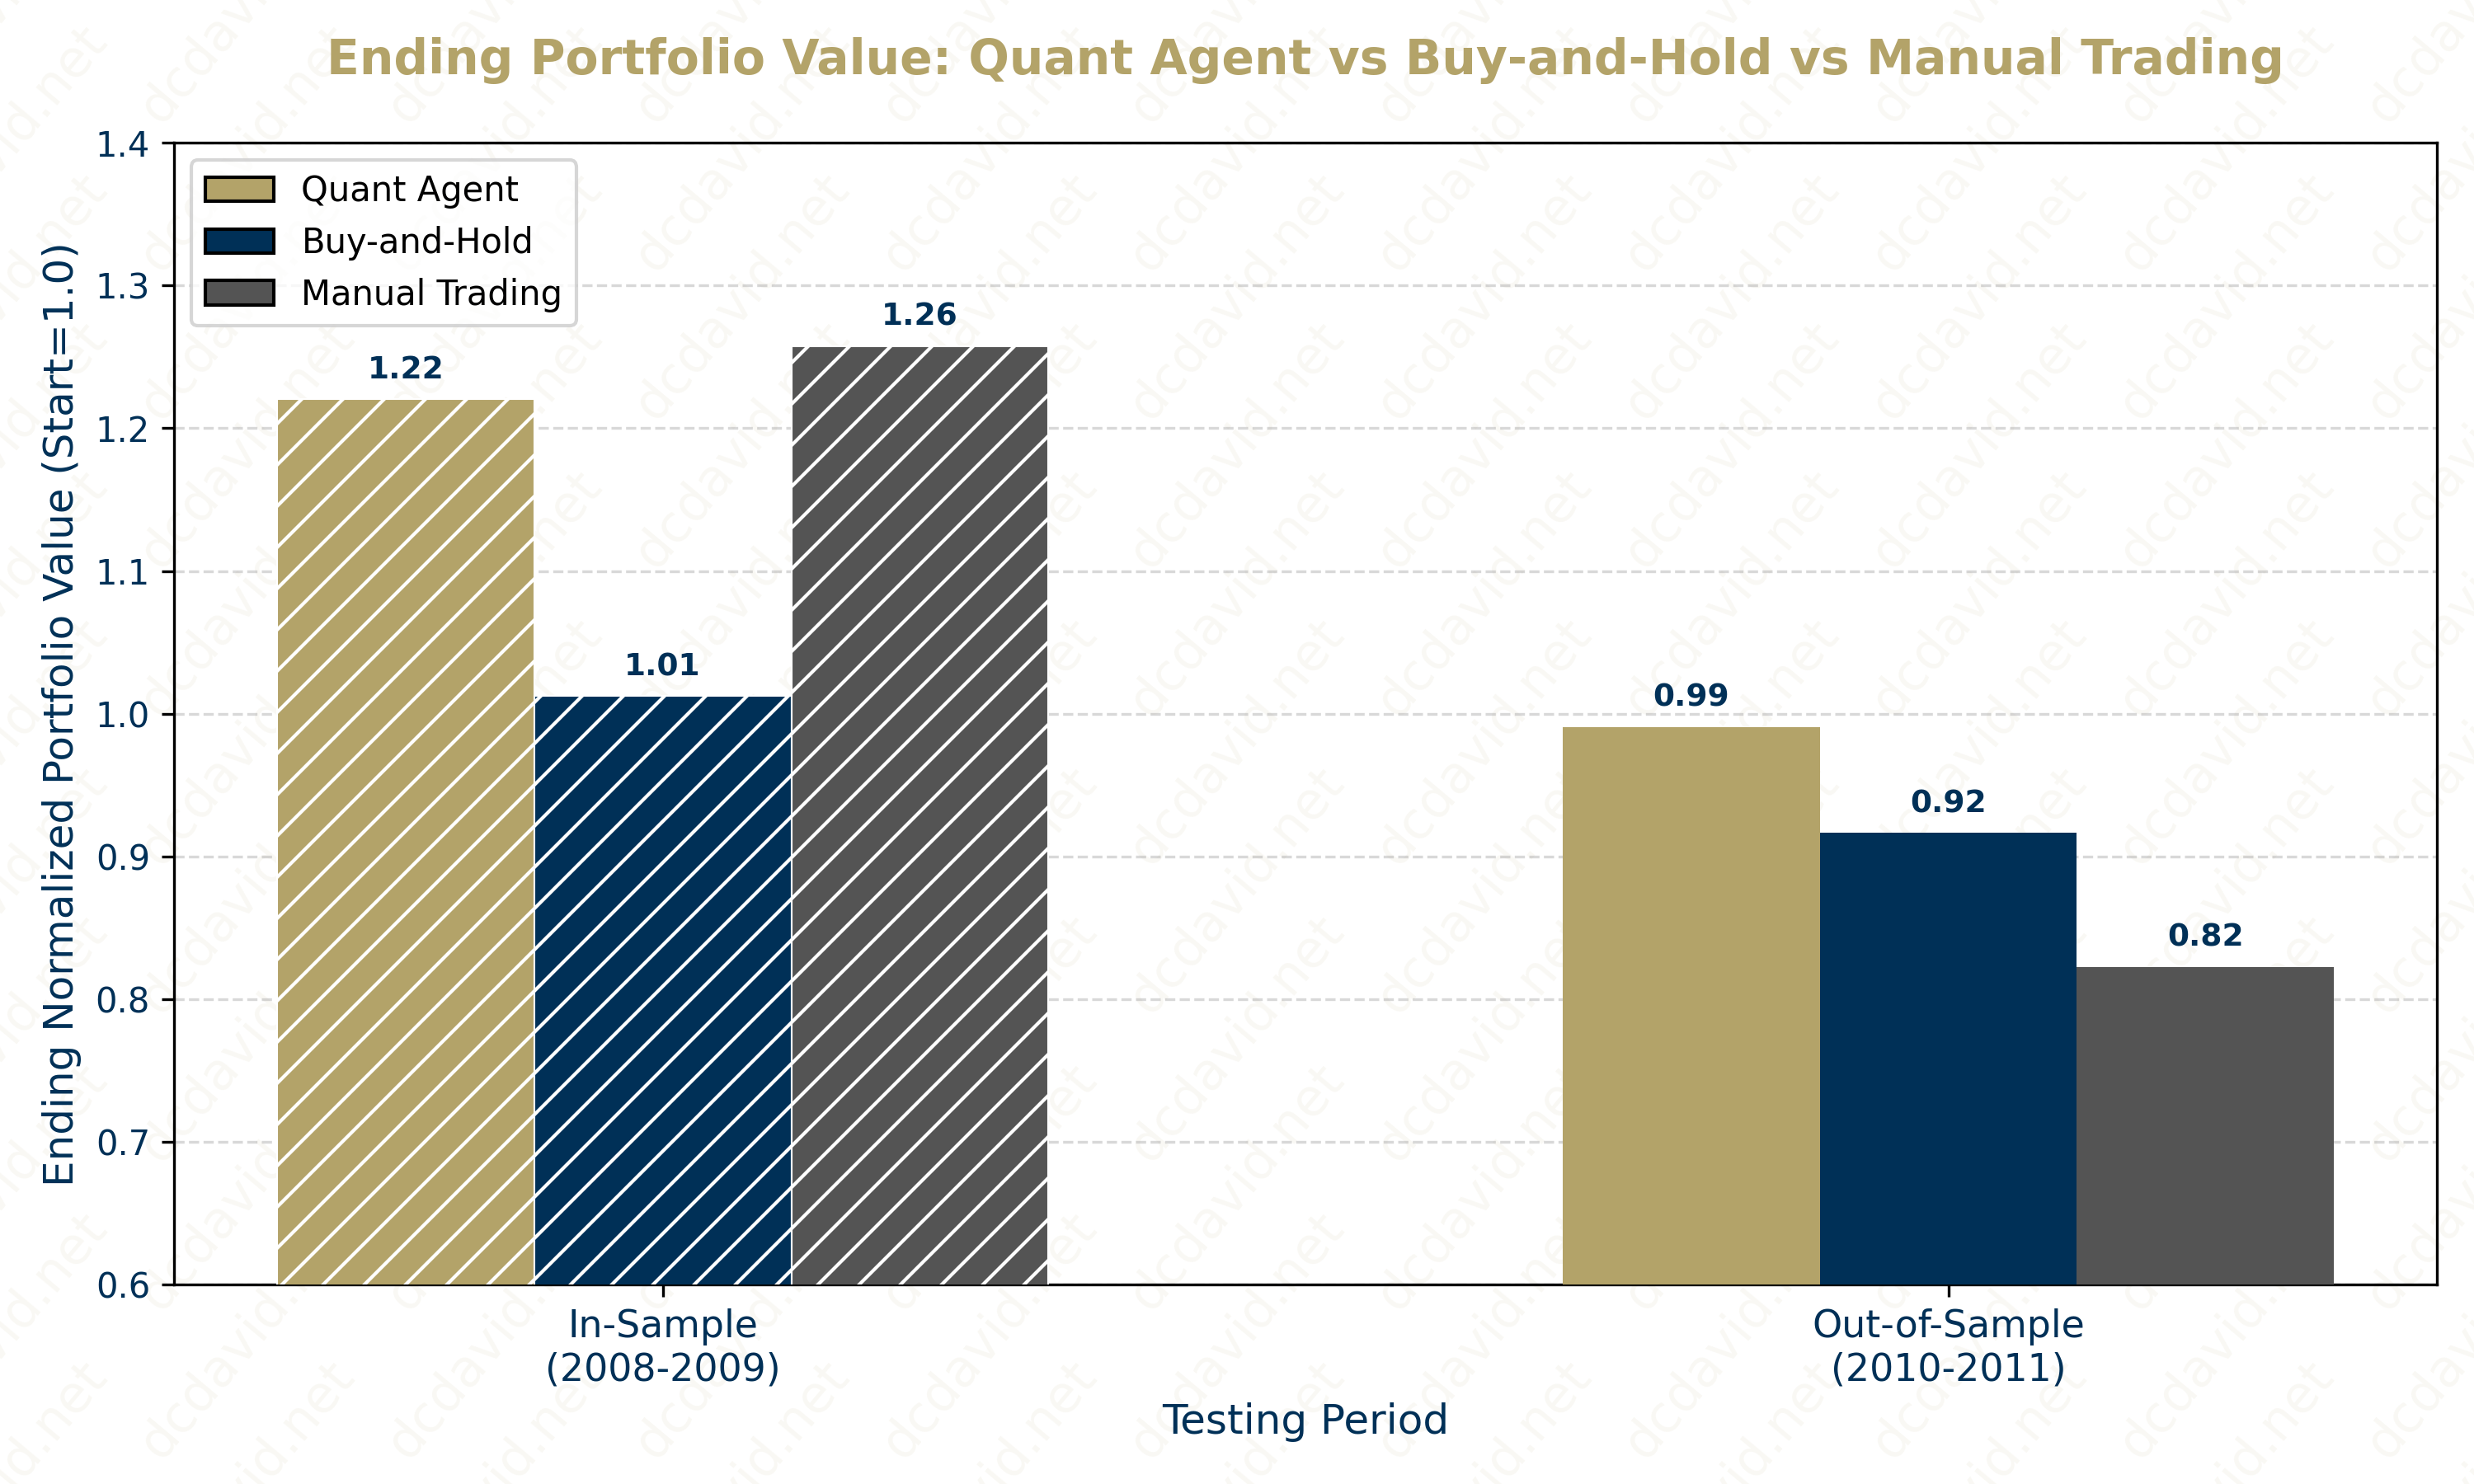
The Quant Agent, powered by a Random Forest model, actively trades $JPM. The agent delivered a statistically robust 7.4% in Excess Returns over the passive Buy-and-Hold benchmark across 10 evaluation iterations. Surpassing this foundational strategy for passive investors validates the methodology's capacity to exploit transient market inefficiencies, converting what would have been an 8% loss for the market (normalized value of 0.92) into a minimal 1% capital preservation for the agent (normalized value of 0.99).
2. Context & Problem Statement
- The Problem:
- The objective was to engineer a trading strategy capable of generating Alpha during the Great Recession. We selected JPMorgan Chase ($JPM) because as the acquirer of failing banks (Bear Stearns, Washington Mutual), $JPM experienced extreme volatility in an already-volatile market. The challenge was to train a Random Forest to identify trading signals in the "Bear Market" crash (In-Sample: 2008-2009) and generalize that logic to the subsequent "Bull Market" recovery (Out-of-Sample: 2010-2011).
- The Challenge of Market Efficiency:
- The Theoretical Barrier: According to the Efficient Market Hypothesis (EMH), current asset prices already reflect (or "price in") all available information. This implies that price changes are driven solely by unpredictable future news (a "Random Walk"), which makes historical patterns theoretically useless for prediction.
- The Benchmark: The standard for success is not just profit, but Alpha (excess returns) over a passive Buy-and-Hold strategy. Most active hedge fund managers fail to beat this baseline over the long term according to the Spiva Scorecard.
- The Goal: My Random Forest agent had to prove that Technical Analysis could uncover inefficiencies in $JPM, such as mean-reversion that the broader market had not yet priced in.
- Academic Angle: This project empirically tests the limits of market efficiency by pitting two theories against each other:
- Testing Weak-Form Efficiency: The Efficient Market Hypothesis comes in three forms. This project specifically challenges Weak-Form Efficiency, which asserts that past price and volume data cannot predict future returns.
- The Behavioral Counter-Thesis: By using Technical Indicators (Relative Strength Index (RSI), Bollinger Band Percent (BBP), and Percentage Price Oscillator (PPO)), the Quant Agent operates on the premise of Behavioral Finance, which is that market participants overreact to news (like the Washington Mutual acquisition), creating identifiable, non-rational price anomalies that a Non-Linear model (Random Forest) can exploit.
3. Methodology & Tech Stack
- Architecture: To generate trading signals, I implemented and compared two distinct strategies:
- Manual Trading: A strategy that uses fixed thresholds for three technical indicators: BBP for mean reversion, RSI for overbought/oversold detection, and PPO for momentum.
- Quant Agent: A Random Forest to accept technical indicators as features (\(X\)) and predict the optimal trading action (\(Y\): Long, Short, or Hold).
- Design Decision (Ensemble Learning): According to the course literature, single Decision Trees are prone to overfitting (high variance). I utilized Random Trees with Bagging (Bootstrap Aggregating), which averages predictions across multiple uncorrelated trees, to create a learner capable of generalizing to unseen market data.
- Tech Stack:
- Language: Python
- Core Libraries: Pandas for time-series analysis, Numpy for vectorized market simulation, and Matplotlib for visualization.
4. Implementation & Key Features
- Feature 1: Solving the opaqueness of a Black Box simulator: Relying on pre-built libraries often obscures the mechanics of how trades actually impact portfolio value. This hinders trust and accountability in the model and the results that it returns.
- Solution: I built a Market Simulator entirely from scratch using Numpy. Instead of using an off-the-shelf backtester, I engineered the logic to process a stream of
LONG/SHORTorders, dynamically updateHoldings, and calculate the daily evolution ofPortfolio Value. To ensure realism, I integrated Market Friction logic (Commission Fees and Impact/Slippage). Crucially, the simulator's accuracy was 100% validated against the course's rigorous Autograder, ensuring that the reported Alpha was driven by the strategy's edge, not by calculation errors or faulty mechanics in the simulator.
- Solution: I built a Market Simulator entirely from scratch using Numpy. Instead of using an off-the-shelf backtester, I engineered the logic to process a stream of
- Feature 2: Solving the Signal-to-Noise Ratio: Financial time-series data is notoriously noisy; a standard model would memorize these outliers (overfitting) rather than learning robust patterns.
- Solution: I implemented the Random Forest learner entirely from scratch by coding the underlying Decision Tree, Random Tree, and Bagging algorithms manually rather than using Scikit-Learn. This granular control allowed me to do Hyperparameter Tuning on the model, by systematically grid-searching for the optimal Leaf Size (to limit model complexity) and Bag Count (to reduce variance) to explicitly balance the Bias-Variance trade-off.
5. Results & Impact
- Quantifiable Metrics:
- In-Sample (Training 2008-2009): The Quant Agent achieved a 22.0% Cumulative Return (Sharpe Ratio: 0.63), effectively matching the aggressive Manual Trading (25.8%) and crushing the Benchmark (1.2%). This confirms the model successfully learned to exploit volatility during the crash.
- Out-of-Sample (Testing 2010-2011): The true test of generalization occurred during the change from Bear to Bull Market. The Quant Agent achieved Capital Preservation (-0.9%) and generating +7.4% Alpha relative to the Benchmark's loss (-8.4%). Notably, Manual Trading that had the best performance In-Sample subsequently collapsed (-17.7% Return) Out-of-Sample. This was a clear sign of overfitting, where manually setting the fixed thresholds for the Manual Trading strategy during the In-Sample period did not yield similarly-positive results in the Out-of-Sample period.
- Impact:
- Overcoming Overfitting: The stark contrast in Out-of-Sample performance highlights the danger of rigid heuristics. Manual Trading was "overfit" to the 2008 crash patterns, failing when the market dynamics changed in 2010.
- Proof of Generalization: The Quant Agent's ability to maintain a flat portfolio value while the underlying asset ($JPM) and Manual Trading both lost significant value proves that the Random Forest successfully learned robust, non-linear signals rather than just memorizing noise.
- Visuals:
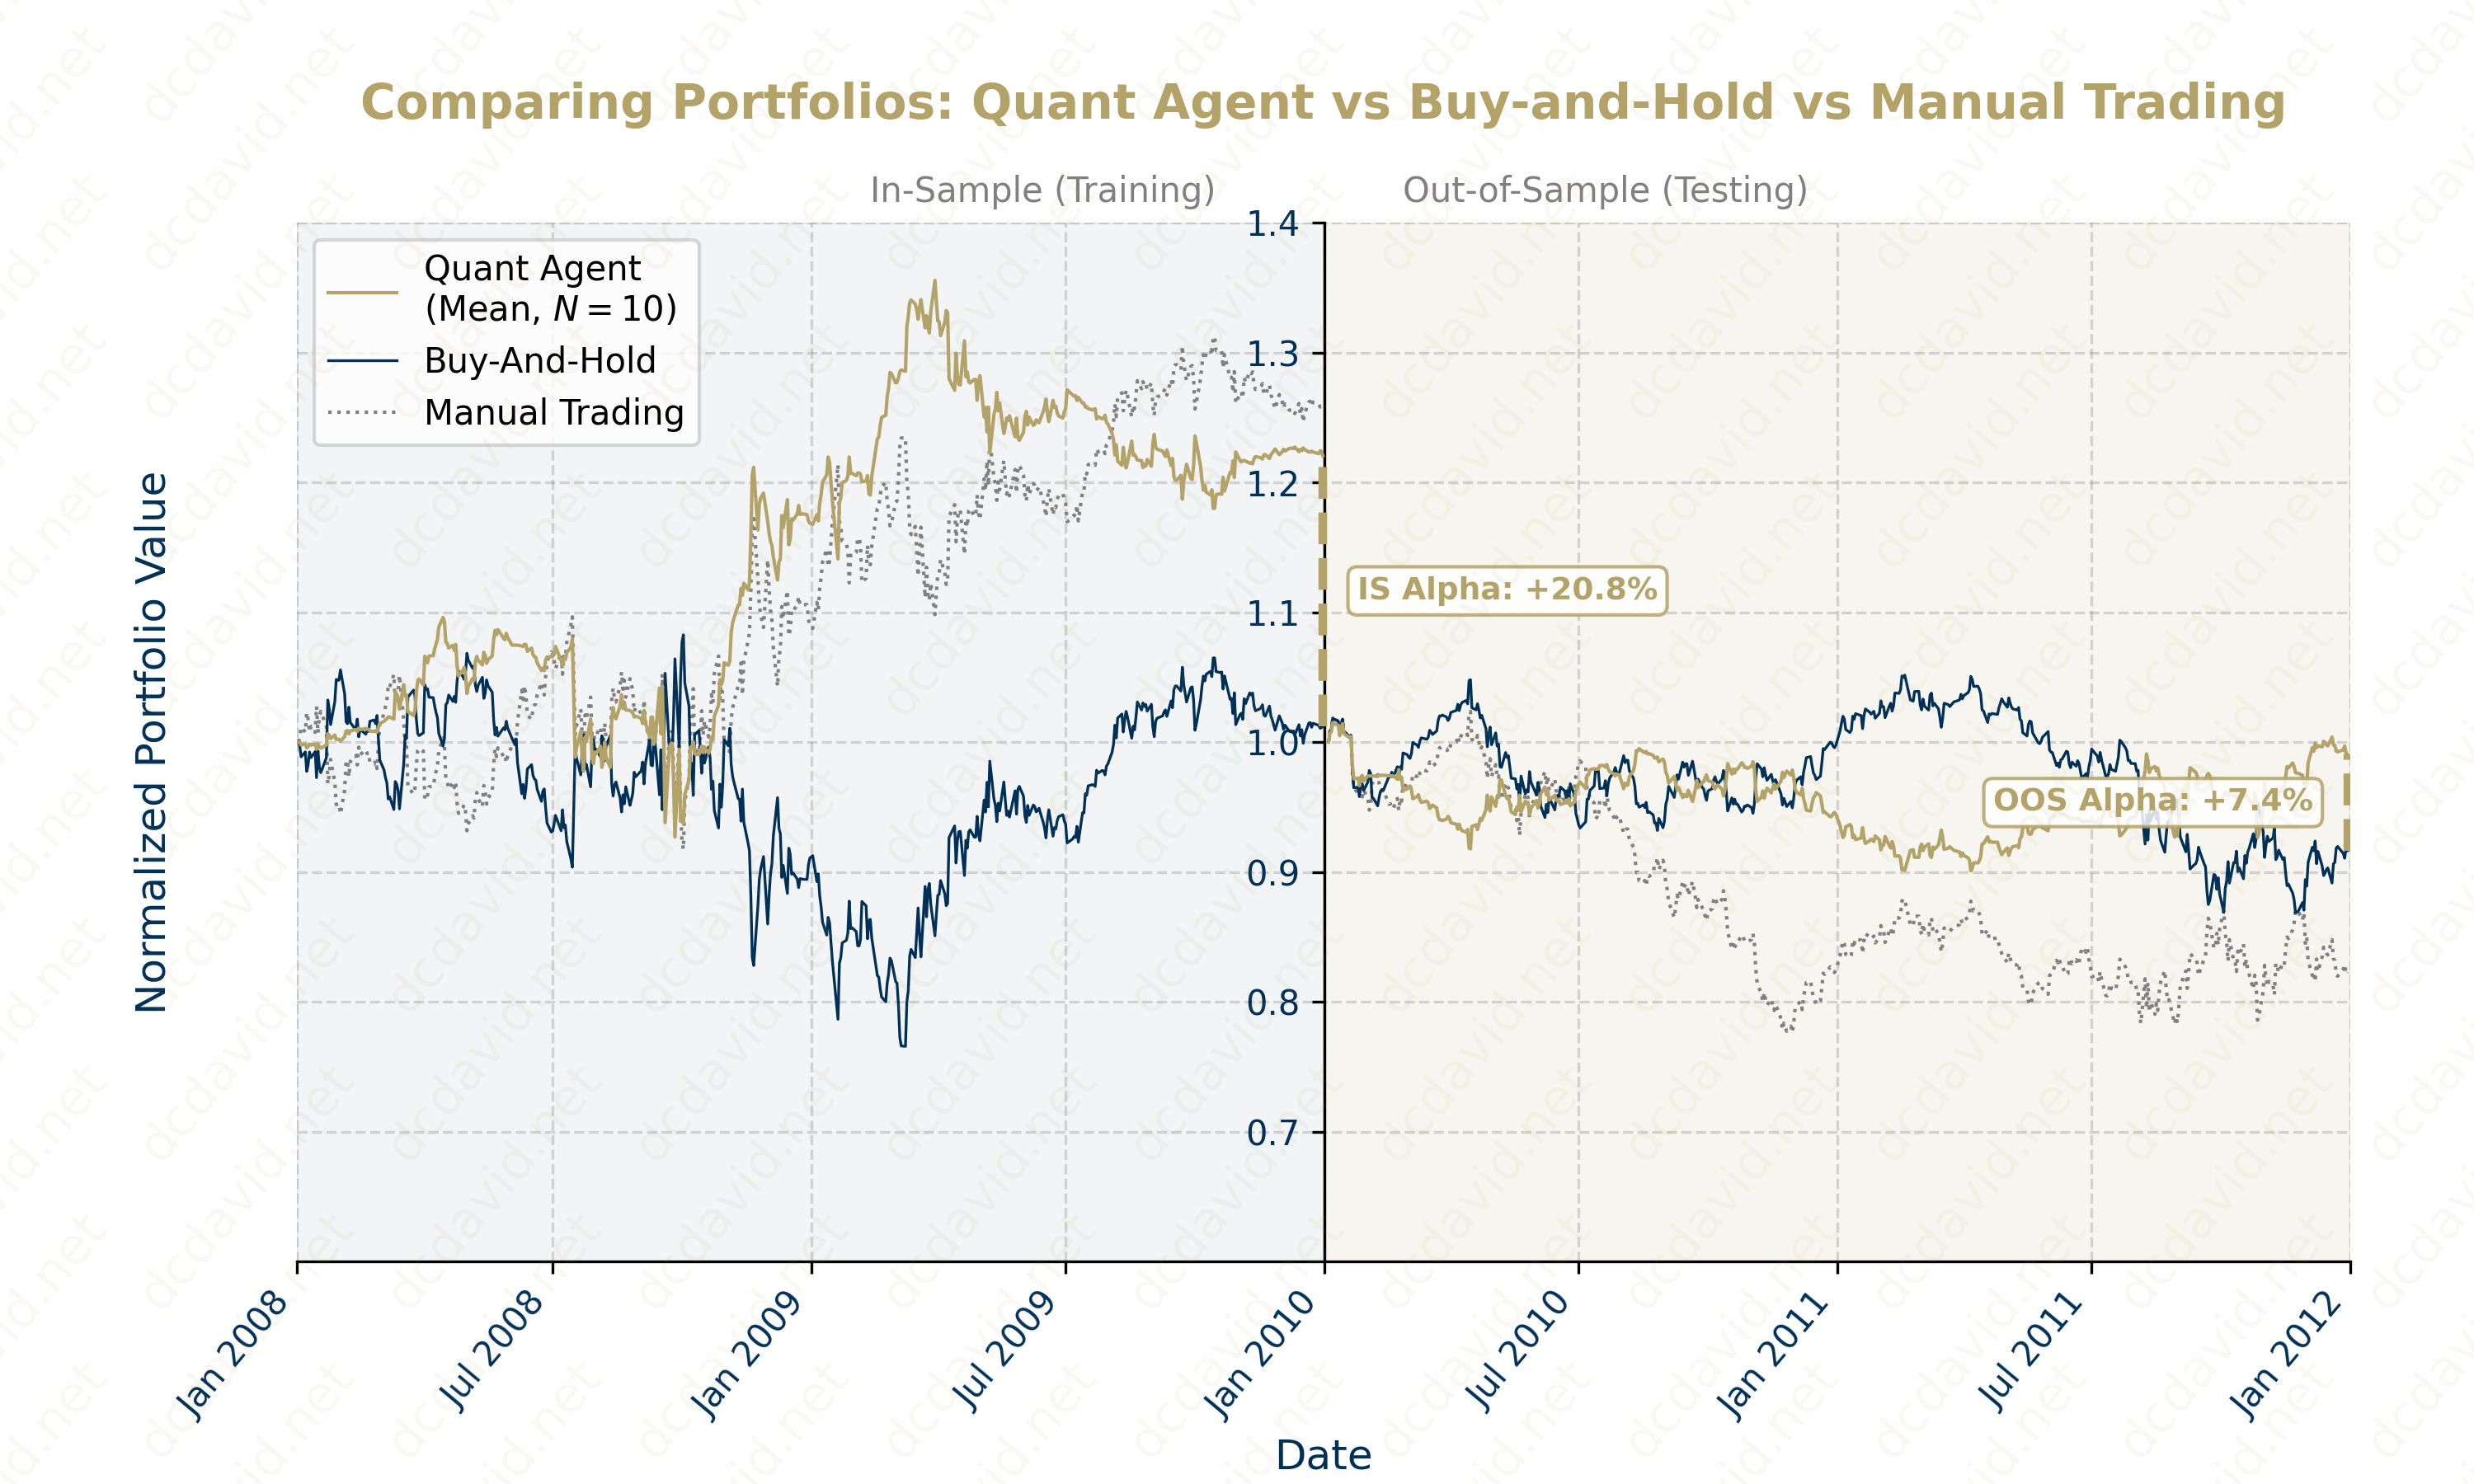
The chart below illustrates the Out-of-Sample divergence. Note how Manual Trading (Gray Dotted Line) performs the best in the In-Sample period in which the fixed technical indicator thresholds were trained, but it performs the worst in the Out-of-Sample period. This is an indicator of severe overfitting. In contrast, the Quant Agent (Gold Line) decouples from the downward trend in the Out-of-Sample period, preserving capital through active risk management.
6. Critical Analysis & Tradeoffs
- Success: Generalization: The primary success was the Quant Agent's ability to navigate Market Regime Change. Manual Trading thresholds were optimized for the high volatility of 2008; when the market calmed in 2010, the hard-coded thresholds became brittle. The Random Forest successfully generalized to the new conditions.
- Limitation: Interpretability: The trade-off for the Quant Agent's performance is Interpretability. While Manual Trading's logic is explicit (e.g., "
LONGif RSI is less thanrsi_threshold"), the Random Forest acts as a "Black Box" with a complex, high-dimensional decision boundary. In a regulated financial environment, this lack of transparency can be a liability. - Future Work: Future iterations could address the data scarcity observed at high impact levels by implementing Reinforcement Learning (Q-Learning). Unlike Supervised Learning, which classifies price direction, a Q-Learner could learn a Policy (\(\pi\)) that optimizes for long-term reward even when transaction costs (Impact) make small trades unprofitable.
7. Course Reflection
- Synthesis: This project bridges the gap between Financial Theory and Data Science. It acknowledges theoretical models (e.g., CAPM) and focusing on empirical validation. It demonstrates that Alpha generation is fundamentally a data engineering challenge. It requires a robust pipeline (e.g., Data Cleaning, Feature Engineering through Technical Indicators, and Ensemble Learning) to transform raw time-series data into actionable signals.
- Algorithm Design (Regression vs. Classification): In an earlier phase of the course, I built a learner for Regression to predict specific future prices. Comparing that to this Quant Agent that uses Classification (
LONG/SHORT) highlighted a trade-off: predicting exact values is noisier and prone to higher error rates. By simplifying the target variable to a ternary signal (+1, -1, 0), the Random Forest could achieve better out-of-sample performance in the predicting short-term Price direction, rather than getting lost in the noise of precise price estimation. - Key Takeaway: The most critical lesson was the danger of Look-Ahead Bias. In technical analysis, "peeking" at future data creates profits that cannot be replicated in live trading. Building the Market Simulator from scratch enabled enforcing the separation between the Quant Agent's Decisions (Orders) and the Market's Reality (Prices) by ensuring the Quant Agent does not have access to information it would not have had in the "real world."
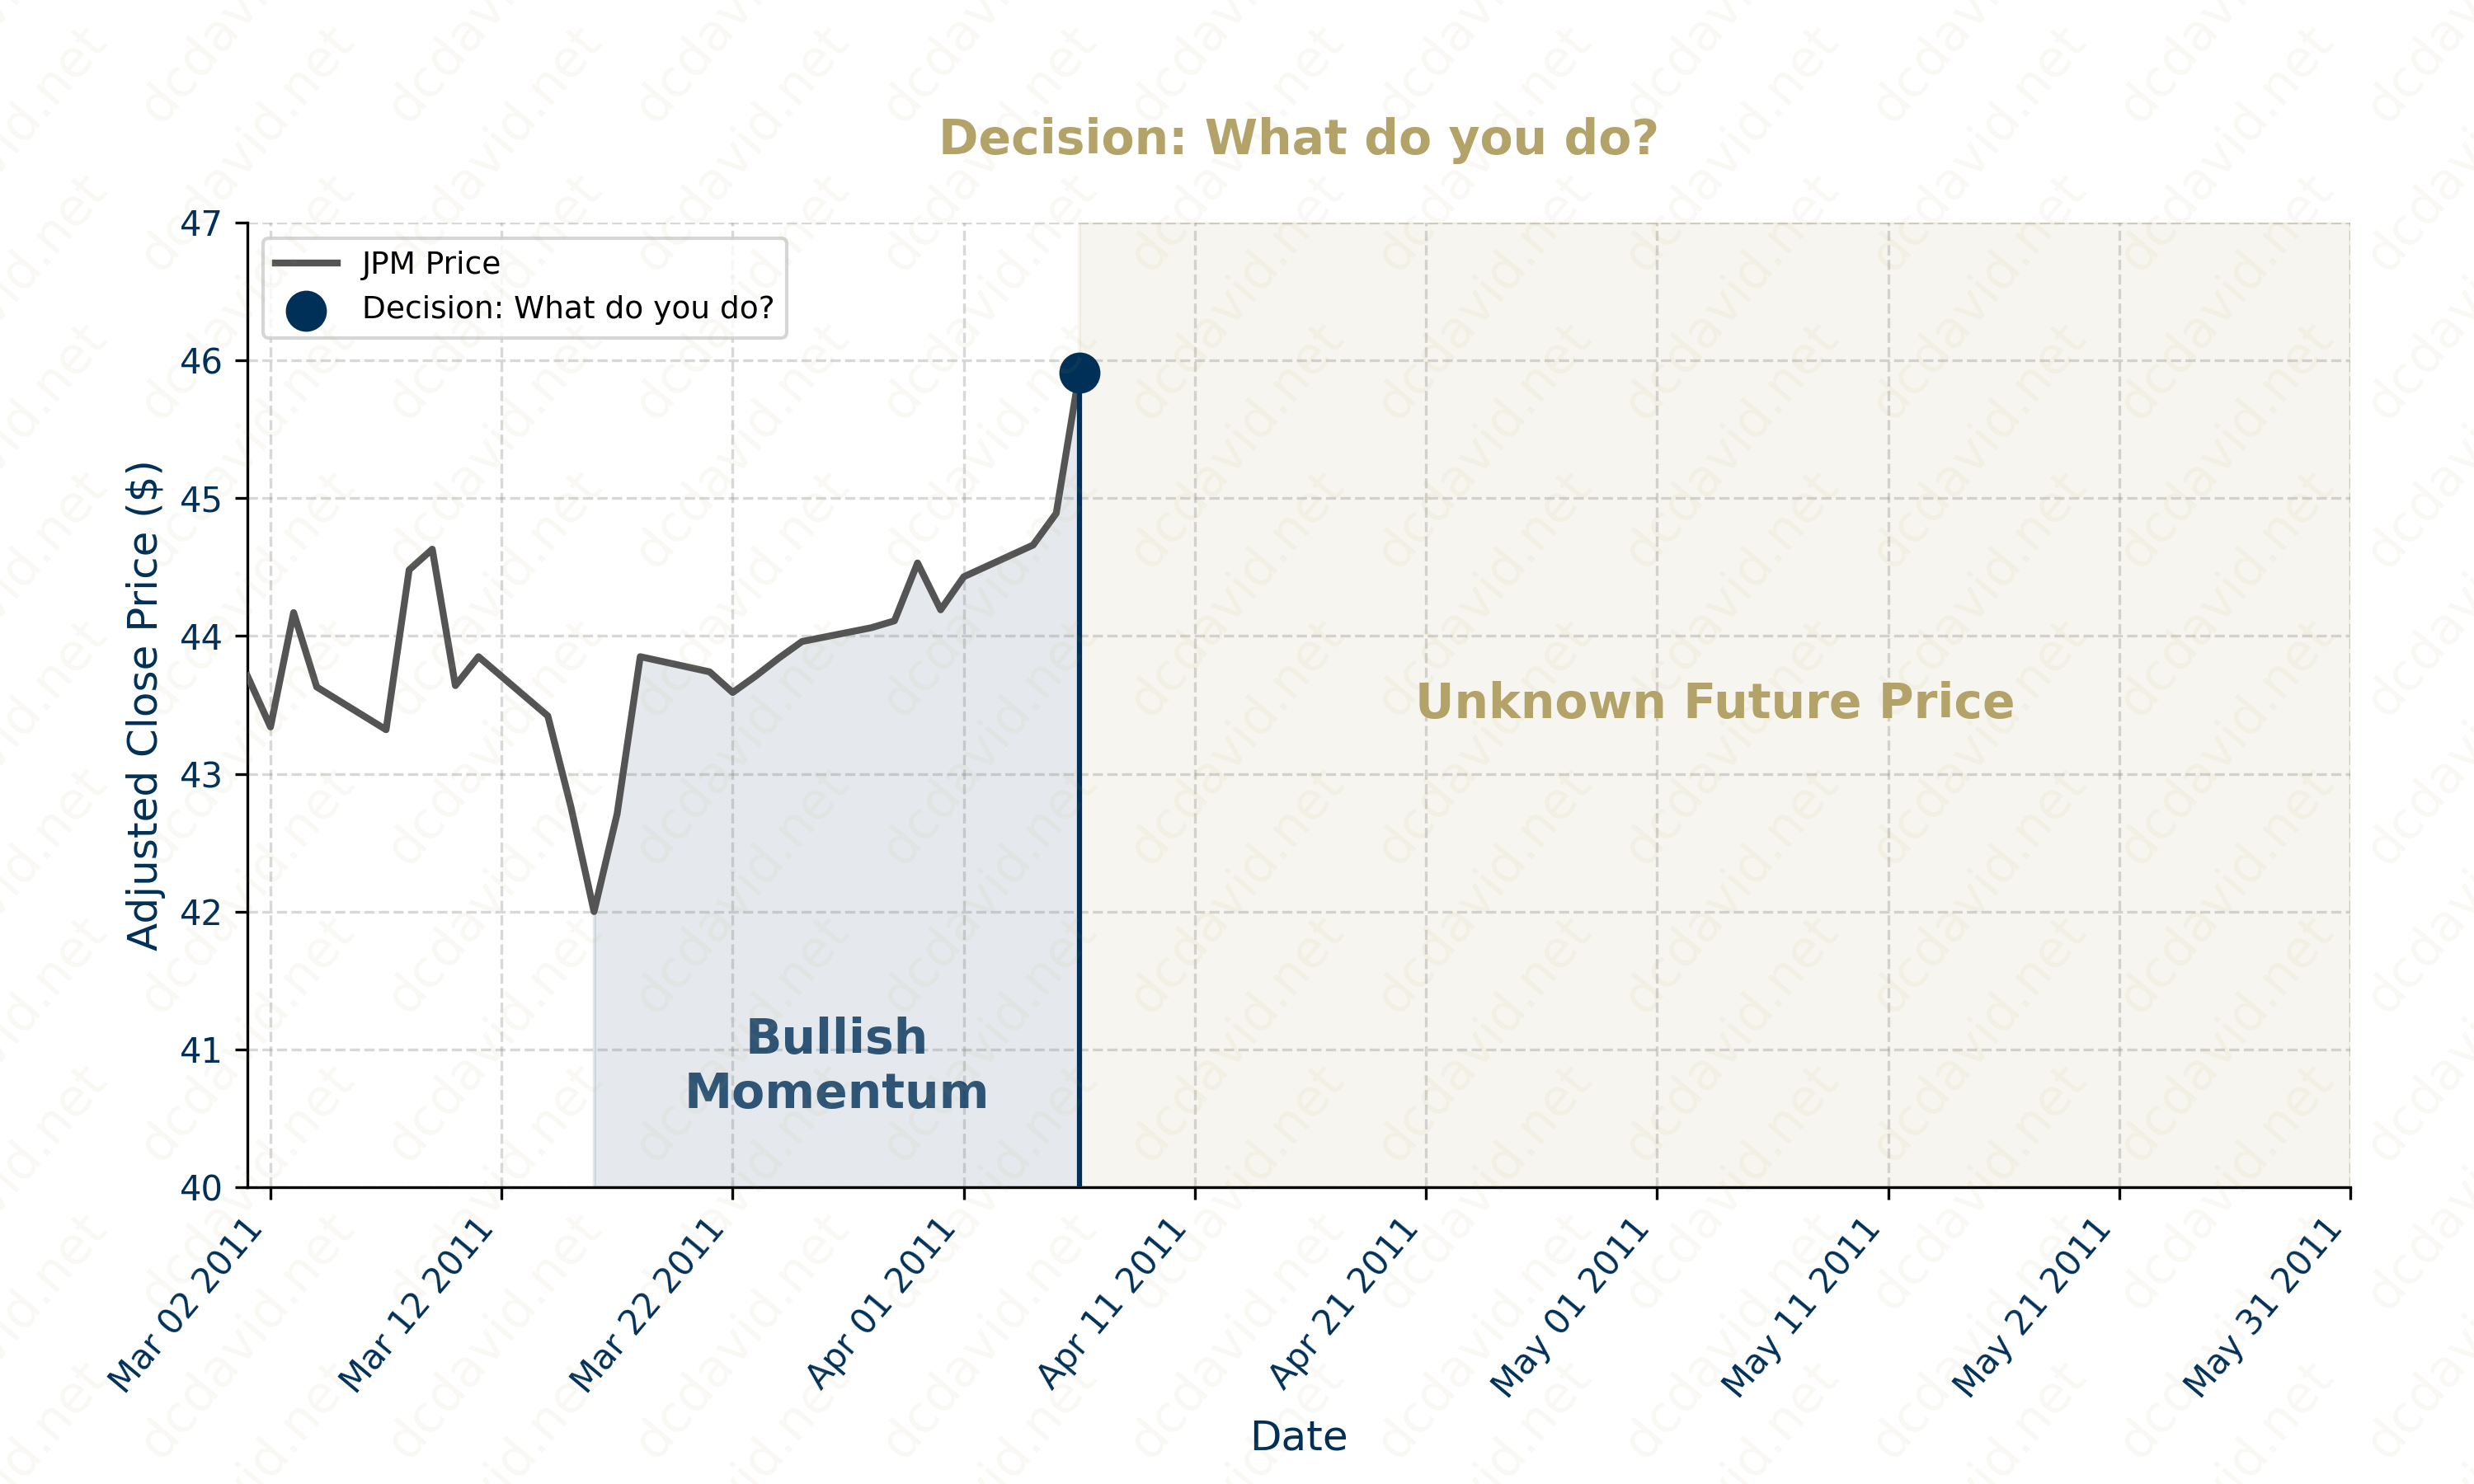
8. Interactive Challenge: The Bullish Momentum of early April 2011
To understand the complexity of analyzing technical indicators, try solving this sample problem yourself.
The Challenge:
-
Understand the Situation: On April 6, 2011, $JPM spikes up to $45.91.
-
Inspect the Technical Indicators: The indicators are flashing "Green," but are they signaling a true positive momentum or a false alarm?
Technical Indicator State State vs. Threshold Interpretation Bollinger Band % High Above Bullish Threshold Strong Bullish Momentum RSI High Above Bullish Threshold Extremely Overbought PPO Slightly Positive Positive but not Above Bullish Threshold Slight Momentum (Positive, but weak) -
Analyze the Chart:
-
Make a Decision:
a. * Go
LONG: The indicators are screaming strength. With the price breaking the Upper Bollinger Band and RSI confirming high momentum, traditional technical analysis suggests a "Breakout." The signal is to GoLONG.b. * Go
SHORT: In the training data (2008 Crash), you noticed that "Breakouts" were frequently Bull Traps. You suspect this "Overbought" pattern isn't momentum, but a signal for Mean Reversion. The signal is to GoSHORT.
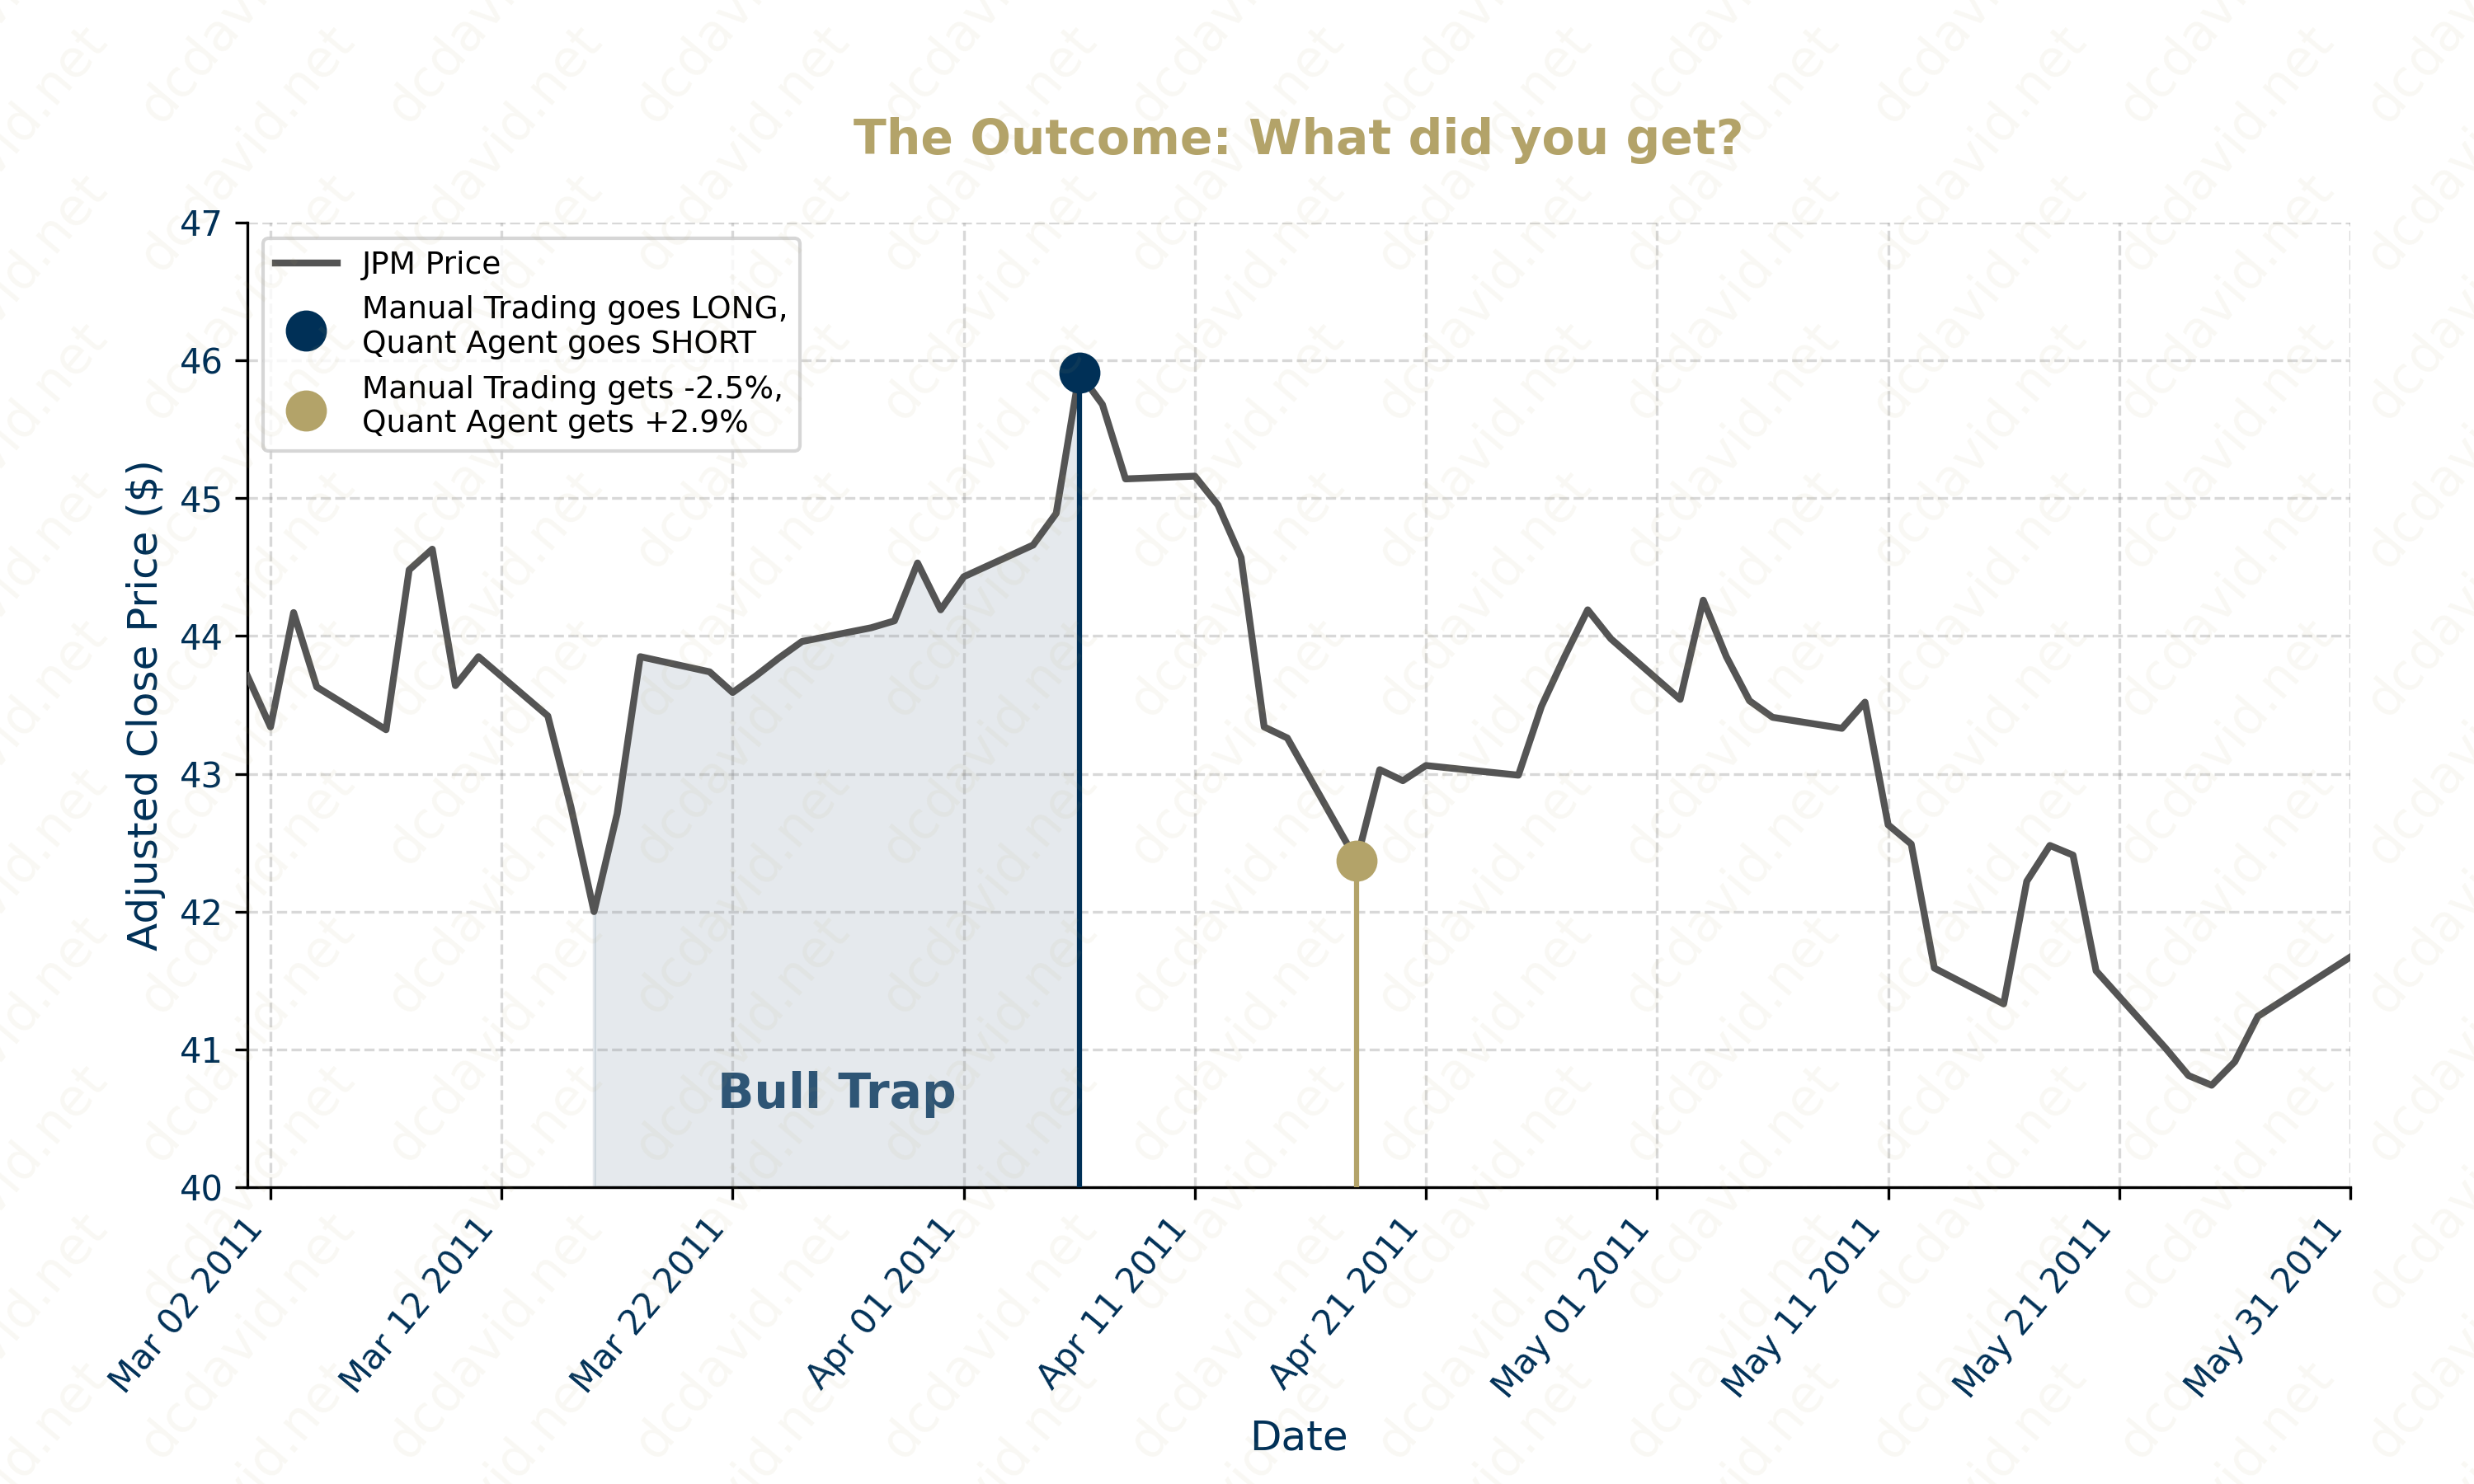
The Solution:
a. If you chose to Go LONG: You bought the exact top. * Immediately after entering the LONG position, $JPM turned upside down. In just 12 days (April 6–18), the stock price crashed from $45.91 to $42.37. You would have realized a -7.7% Loss.
b. If you chose to Go SHORT: You profited from the crash. * By correctly identifying the "Bull Trap" and shorting the stock at the peak, you would have captured the entire downward move. You would have realized a +7.7% Gain.
Academic Integrity Note
This project overview is intended for professional portfolio purposes only. In strict adherence to the Georgia Tech Academic Honor Code and the general standard that no source code be made public:
- No Source Code: No implementation logic, code snippets, or solution files are included. The content is strictly limited to high-level methodology and architectural concepts.
- Watermarked Visuals: All charts and visualizations are watermarked with
dcdavid.netto prevent unauthorized reuse or submission. - Non-Replicable Analysis: The analysis relies on specific, non-standard configurations (such as self-selected datasets, custom timeframes, or self-generated test cases) and does not represent a universal answer key for active course assignments.